
The X analytics dashboard provides a direct view into how your audience interacts with your posts, offering the raw data needed to refine your social media strategy. By monitoring key performance indicators like impressions, engagement rates, and link clicks, you can identify which content formats resonate best with your followers. This guide explains how to read the native tools provided by the platform to make informed decisions for your account growth without relying on guesswork or complex external software.
Where can you find your X analytics dashboard?
Accessing your data is the first step toward understanding your account performance. On the web version of the platform, you can locate the analytics section by clicking the ‘More’ icon in the sidebar menu. From there, select ‘Creator Studio’ and click on ‘Analytics.’ This area serves as your primary hub for reviewing monthly performance summaries, top-performing posts, and audience demographics. It is a good practice to check this dashboard at least once a week to capture fluctuations in activity during specific campaigns or product launches.

What do the main dashboard metrics actually mean?
The primary overview page shows several high-level figures that represent the health of your account. Impressions count how many times your post was seen on the platform, while engagement rate measures the ratio of interactions to impressions. Link clicks represent users who navigated away from the platform to your website. Understanding these definitions helps you distinguish between visibility and actual interest. If your impressions are high but your engagement rate is low, it suggests your content appears in feeds but does not capture enough attention to prompt a click or a reply.
How should you evaluate your top-performing content?
Reviewing your top-performing tweets requires looking beyond simple vanity metrics like total likes. Instead, filter your content by specific engagement types to see what drives meaningful action. For instance, if you want to drive website traffic, sort your posts by link clicks to see which copy or imagery styles correlate with higher conversion rates. Conversely, if you are focused on building brand awareness, look for posts with high retweet counts, as these indicate content that your audience finds valuable enough to share with their own networks.
| Metric | Primary Use | What it indicates |
|---|---|---|
| Impressions | Brand Awareness | Visibility and reach |
| Engagement Rate | Content Quality | Interest and relevance |
| Link Clicks | Conversion Tracking | Direct user interest |
How Alien Road applies X analytics for clients
At Alien Road, we use the native X analytics dashboard to build foundational content pillars for our clients. During a typical engagement, we begin by auditing the client’s past six months of activity to establish a baseline for engagement rates and peak posting times. We then segment this data into categories like educational, promotional, and community-building content. By observing which category consistently generates the most link clicks, we provide recommendations on where to shift the client’s focus for future content calendars. This process ensures that every decision is based on direct audience feedback rather than assumptions about what users want to see.
Which common patterns should you look for?
In a typical account, you will often find that certain posting times result in significantly better performance than others. Use the dashboard to identify these specific windows by comparing the engagement rates of posts made in the morning versus those made in the evening. Additionally, look for trends in content format; for example, you might find that short, punchy statements outperform long-form threads. Once you identify these patterns, you can adjust your posting schedule and format to match the behavior of your most active followers.
Key indicators for account health
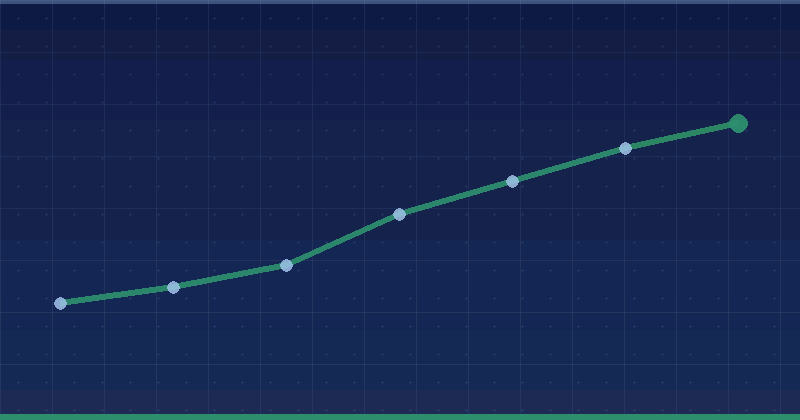
- Consistent growth in total impressions over a 30-day period.
- Stable or increasing engagement rates on original content.
- A clear correlation between specific call-to-action phrases and link clicks.
- High reply counts on posts that ask direct questions to the audience.
How can you improve your content strategy based on data?
Turning data into action involves making incremental changes to your content based on what the analytics dashboard highlights. If you notice that posts with images perform better than text-only posts, commit to adding visual elements to your upcoming content schedule for two weeks. If a particular topic consistently receives high engagement, create a follow-up post or a thread that goes deeper into that subject matter. Always maintain a record of your changes so you can track whether the updates lead to the improvements you expect.
Actionable steps to refine your approach
- Audit your top five posts from the last month to identify common themes.
- Compare the performance of posts with media against those without.
- Document the specific time of day when your top three posts were published.
- Experiment with different headline styles to see which drives more clicks.
Where to start this week
Log in to your X analytics dashboard today and export your data for the last 30 days into a spreadsheet. Identify your top three posts by engagement rate and write down one reason why you think each one performed well. Once you have identified these strengths, plan to recreate those specific formats three times over the coming week. By focusing on your best-performing content, you avoid wasting energy on posts that do not provide value to your audience or your growth objectives.
Frequently Asked Questions
Is the X analytics dashboard free to use?
Yes, the native analytics dashboard provided by the platform is free for all users. You do not need to pay for a premium subscription to access your basic performance data, impressions, or engagement metrics. It is available directly through the web interface for every account, allowing you to monitor your progress and adjust your strategy at no additional cost to your business.
How far back can I see my analytics data?
The platform typically allows you to view analytics data for a significant period. While the dashboard view may default to the last 28 or 30 days, you can often filter for specific date ranges or pull historical data for several months. For long-term tracking, it is recommended to download your data into a spreadsheet regularly to maintain a personal archive of your performance trends.
Why are my impressions dropping?
A drop in impressions can occur for several reasons, including changes in posting frequency, shifts in audience interest, or updates to platform algorithms. If you see a decline, check if your posting schedule has been consistent. Also, consider if your content is still meeting the needs of your audience. Reviewing your top posts from when your impressions were higher can help you identify what might have changed.
Should I focus on impressions or engagement?
The focus depends on your current goals. If you are trying to build brand awareness, impressions are a useful metric to track. However, if you are looking to drive website traffic or build a loyal following, engagement is more important. A high engagement rate indicates that your content is meaningful to your audience, which often leads to better long-term growth than simply reaching a wide, passive audience.
Keep reading: Tiktok Ads · Social Media Marketing