
X analytics metrics are the quantitative indicators that define how your content performs on the platform. By observing the native dashboard, users can track impressions, engagement rates, profile visits, and follower growth. Understanding these signals allows you to adjust your posting schedule and content style to better match the preferences of your audience. Whether you manage a personal brand or a business profile, these metrics provide the clarity needed to refine your presence effectively.
Why should you monitor your X analytics dashboard?
Consistency remains the primary driver of growth on X. When you review your analytics regularly, you identify which topics generate the most interest. For instance, a typical account might find that posts containing images receive more engagement than text-only updates. By tracking these trends, you avoid guessing which posts to create next. You gain a clear view of your audience demographics, including their location and interests, which helps in tailoring your language and posting times to their active hours.
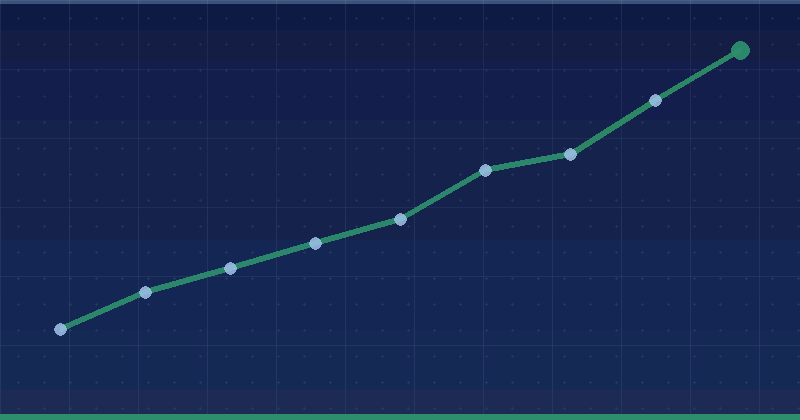
Another reason to monitor these metrics is to verify the health of your follower base. Rapid spikes or drops in followers often correlate with specific events or campaigns. If you notice a sudden dip, you can check your recent posts to see if the content frequency or tone shifted significantly. Keeping a close watch on these fluctuations ensures that your account remains aligned with your overall marketing goals without needing to rely on assumptions about what your followers want.
What are the core metrics to track on X?
To build a solid reporting structure, focus on a few primary metrics. Impressions represent the total number of times a post has been seen by users. Engagement rate, calculated as the total engagements divided by impressions, shows how effectively your content resonates with the audience. Profile visits indicate how many users were curious enough to click through to your main page. These three metrics form the foundation of any evaluation process for a brand presence.
- Impressions: Total views of your post in timelines and search results.
- Engagement Rate: The percentage of viewers who interacted with your post.
- Profile Visits: The number of times users clicked your handle to view your profile.
- Link Clicks: Tracking how many users followed your call to action to an external site.
- Retweets and Quotes: Indicators of how valuable your content is to your followers.
How can you interpret engagement data?
Engagement is not just about likes; it is about the conversation generated by your posts. Replies and quotes are often more valuable than simple likes because they signify that your content prompted an active response. When you see a high number of replies, it suggests your content is starting a discussion. If you see high impressions but low engagement, consider whether your hook or visual element was compelling enough to stop the user from scrolling.

You should also look at the relationship between link clicks and total impressions. A high impression count with very few link clicks suggests that your content might be interesting, but your call to action is not convincing enough. By testing different phrases or clearer instructions in your posts, you can improve these conversion metrics over time. Always compare similar post types against each other to ensure your conclusions are based on consistent data points.
How Alien Road applies X analytics
At Alien Road, we follow a strict process for every client engagement. We start by auditing the last three months of activity to establish a baseline for performance. We look for patterns in post timing and content format to identify what currently works. Once we establish this baseline, we implement a testing phase where we vary the timing and content types. We then measure the change in engagement rates against the baseline to prove efficacy.
Our team avoids vanity metrics like follower count alone. Instead, we focus on meaningful interactions and click-through rates that lead to tangible business outcomes. For example, when managing a campaign for a service provider, we prioritize the volume of profile visits and link clicks to ensure the audience is moving toward the sales funnel. By documenting these shifts in a monthly report, we provide our clients with a clear picture of their return on effort.
Comparing platform metrics for better decisions
| Metric Category | Primary Goal | Success Indicator |
|---|---|---|
| Reach | Brand Awareness | High Impressions |
| Interaction | Community Building | High Replies and Quotes |
| Conversion | Drive Traffic | High Link Click Rate |
How to optimize your posting schedule
Finding the right time to post depends on when your specific audience is active. The analytics dashboard provides information on when your followers are most likely to interact with your content. A common pattern is that engagement peaks during lunch hours or early evening. We suggest testing three different posting times for two weeks to see which generates the best results. Stick to the times that show consistent engagement rather than spreading your efforts too thinly.
- Audit the past 30 days of posts to find high-performing content.
- Identify the time of day that generates the most engagement.
- Test a new posting schedule with a consistent content format.
- Review your dashboard weekly to adjust based on current trends.
- Focus on top-performing content types to scale your growth.
Where to start this week
Begin your journey by exporting your data from the X analytics portal. Download the CSV file for the last month and organize it by engagement rate. Identify the top five posts and analyze why they succeeded. Were they questions, polls, or shared articles? Once you have this list, create five new posts that mirror the style of those successful ones. Commit to this cycle of analysis and creation for one month to observe the impact on your account performance.
Frequently Asked Questions
How often should I check my X analytics?
You should check your analytics at least once a week. This allows you to identify trends early and make adjustments to your posting schedule before a full month passes. Checking too frequently might lead to reacting to minor daily fluctuations, while checking monthly might cause you to miss opportunities to capitalize on emerging content interests.
Does high follower count matter more than engagement?
Engagement is significantly more important than follower count. A large following that does not interact with your content provides little value for brand growth. High engagement rates signal to the platform that your content is interesting, which can help your posts reach a wider audience beyond your existing followers.
What is considered a good engagement rate?
A good engagement rate varies by industry and account size. Rather than aiming for a specific global percentage, focus on improving your own baseline. If your current average is 1 percent, aim to reach 1.2 percent over the next month. Always compare your performance against your own previous results to ensure meaningful growth.
Can I use external tools for X analytics?
Yes, many professionals use third-party tools to aggregate data. These tools can provide deeper insights and easier visualization of your performance over long periods. However, always verify that these tools pull data directly from the official X API to ensure the accuracy of the metrics you are reviewing for your business decisions.
Keep reading: Tiktok Ads · Social Media Marketing