Lunes, 19 de septiembre de 2016

A medida que #AMPlify tu sitio con
Accelerated Mobile Pages, es importante vigilar periódicamente el estado de validación de tus páginas, ya que solo las páginas AMP válidas son elegibles para aparecer en la Búsqueda de Google.
Al implementar AMP, a veces las páginas contendrán
errores lo que provocará que la Búsqueda de Google no las indexe. Las páginas también pueden contener advertencias que son elementos que no siguen las mejores prácticas o que se convertirán en errores en el futuro.
Google Search Console es una herramienta que te permite comprobar cuáles de tus páginas AMP ha identificado Google
como con errores. Una vez que sepas qué URL tienen problemas, existen algunas herramientas útiles que pueden facilitar la verificación de los detalles de los errores de validación.
Browser Developer Tools
Para utilizar las Herramientas de desarrollo para la validación:
- Abre tu página AMP en tu navegador
- Añade
#development=1a la URL, por ejemplo,
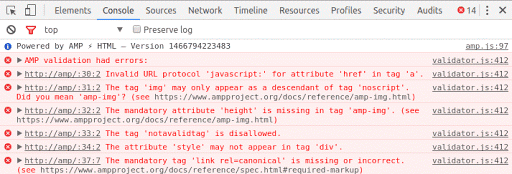
https://localhost:8000/released.amp.html#development=1. - Abre la consola de Chrome DevTools y busca errores de validación.
Los errores de la consola de desarrollo se verán similares a esto:
AMP Browser Extensions
Con las extensiones de navegador AMP (disponibles para
Chrome y
Opera), puedes identificar rápidamente y depurar páginas AMP no válidas. Mientras navegas por tu sitio, la extensión evaluará cada página AMP visitada y dará una indicación de la validez de la página. La siguiente tabla muestra los diferentes iconos que las extensiones pueden mostrar según la validez del marcado AMP.
 | Cuando hay errores en una página AMP, el icono de la extensión se muestra en color rojo y muestra el número de errores encontrados. |
 | Cuando no hay errores en una página AMP, el icono se muestra en color verde y muestra el número de advertencias, si las hay. |
 | Cuando la página no es AMP pero indica que hay una versión AMP disponible, el icono se muestra en color azul con un icono de enlace, y al hacer clic en la extensión, el navegador redirigirá a la versión AMP. |
Usar las extensiones significa que puedes ver qué errores o advertencias tiene la página haciendo clic en el icono de la extensión. Cada problema enumerará la línea de origen, la columna de origen y un mensaje que indica qué está mal. Cuando existe una descripción más detallada del problema, un enlace “Más información” te llevará a la página correspondiente en ampproject.org.

AMP Web Validator
El Validador Web AMP, disponible en
validator.ampproject.org, proporciona una interfaz web sencilla para probar la validez de tus páginas AMP.

Para utilizar la herramienta, introduces una URL AMP o copias y pegas tu código fuente, y el validador web muestra mensajes de error entre líneas. Puedes realizar ediciones directamente en el validador web, lo que activará una nueva validación, haciéndote saber si tus modificaciones propuestas solucionarán el problema.
¿Cuál es tu forma favorita de comprobar el estado de tus páginas AMP? Comparte tus comentarios a continuación o en nuestra
Google Webmasters Google+ page. O como siempre, si tienes alguna pregunta o necesitas ayuda, puedes publicar en nuestro
Webmasters Help Forum.
Cómo lo aplicamos
We archive Search Central announcements because client questions often trace back to a change that was announced years ago. Reading the original is faster than reconstructing it from second-hand summaries.
Servicios relacionados