Thursday, December 12, 2013
Since we
launched the Structured Data dashboard
last year, it has quickly become one of the most popular features in Webmaster Tools. We’ve been
working to expand it and make it even easier to debug issues so that you can see how Google
understands the marked-up content on your site.
Starting today, you can see items with errors in the Structured Data dashboard. This new feature
is a result of a collaboration with webmasters, whom we invited in June to>register as early
testers of markup error reporting in Webmaster Tools. We’ve incorporated their feedback to improve
the functionality of the Structured Data dashboard.
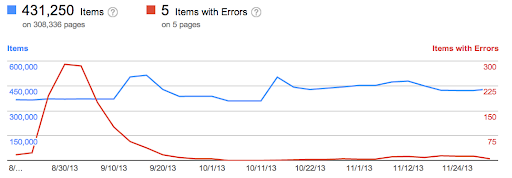
An “item” here represents one top-level structured data element (nested items are not counted)
tagged in the HTML code. They are grouped by data type and ordered by number of errors:

We’ve added a separate scale for the errors on the right side of the graph in the dashboard, so
you can compare items and errors over time. This can be useful to spot connections between changes
you may have made on your site and markup errors that are appearing (or disappearing!).
Our data pipelines have also been updated for more comprehensive reporting, so you may initially
see fewer data points in the chronological graph.
How to debug markup implementation errors
- To investigate an issue with a specific content type, click on it and we’ll show you the markup
errors we’ve found for that type. You can see all of them at once, or filter by error type using
the tabs at the top: - Check to see if the markup meets the
implementation guidelines for each content type.
In our example case (events markup), some of the items are missing astartDateor
nameproperty. We also surface missing properties for nested content types (for
example, a review item inside a product item)—in this case, this is the
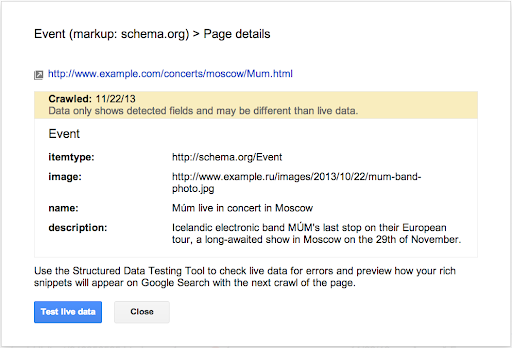
lowpriceproperty. - Click on URLs in the table to see details about what markup we’ve detected when we crawled the
page last and what’s missing. You’ll can also use the “Test live data” button to test your
markup in the
Structured Data Testing Tool.
Often when checking a bunch of URLs, you’re likely to spot a common issue that you can solve
with a single change (for example, by adjusting a setting or template in your content management
system). - Fix the issues and test the new implementation in the
Structured Data Testing Tool.
After the pages are recrawled and reprocessed, the changes will be reflected in the Structured
Data dashboard.
We hope this new feature helps you manage the structured data markup on your site better. We will
continue to add more error types in the coming months. Meanwhile, we look forward to your comments
and questions here or in the dedicated Structured Data section of the
Webmaster Help forum.
How we apply this
Google announcements age. We keep this post here for the record, and we note for clients whether the behaviour it describes still applies today or has since been superseded.
Related services