Üstünlük verilən domenlərin təyin edilməsi | Alien Road
Rəylərinizə əsasən, son vaxtlar Veb-usta Alətlərinin (Webmaster Tools) üstünlük verilən domen xüsusiyyətində bir sıra dəyişikliklər etmişik. Googlebot fəaliyyət hesabatları
19 oktyabr 2006-cı il, Cümə axşamı
The
Webmaster Tools
komandasının çox maraqlı bir missiyası var: loqlarımızı araşdırır, mümkün qədər çox faydalı məlumat tapır və onu sizə – veb-ustalara ötürürük. Mükafatımız odur ki, siz Google-un nə gördüyünü və bəzi səhifələrin niyə indeksə düşmədiyini daha asan başa düşürsünüz.
Sizin üçün bir araya gətirdiyimiz son məlumat paketi Google ilə müəyyən sayt arasındakı trafikin həcmidir. Biz sizə sorğuların sayını, kilobaytların miqdarını (bəli, bilirəm ki, texniki biliklərə malik veb-ustalar adətən bunu özləri əldə edə bilirlər, lakin yeni diaqramlarımız bunu bir baxışda görməyi çox asanlaşdırır) və orta sənəd endirilmə vaxtını göstəririk. Bu məlumatı diaqram şəklində, həmçinin dəqiq rəqəmlərlə (maksimum, minimum və orta) görə bilərsiniz.
Məsələn, baxın: Googlebot son 90 gündə Webmaster Central bloqunda neçə səhifə tarayıb. Googlebot-un bir gündə taradığı səhifələrin maksimum sayı 24, minimum sayı isə 2-dir. Bu, məntiqlidir, çünki bloq 90 gündən az müddət əvvəl istifadəyə verilib və diaqram göstərir ki, gündə taranan səhifələrin sayı zamanla artıb. Taranan səhifələrin sayı bəzən saytdakı ümumi səhifə sayından çox olur – xüsusən də eyni səhifəyə bir neçə URL vasitəsilə daxil olmaq mümkündürsə. Buna görə də
/search/blog/2006/10/learn-more-about-googlebots-crawl-of

və

/search/blog/2006/10/learn-more-about-googlebots-crawl-of#enhanced-image-search
fərqlidir, lakin eyni səhifəyə işarə edir (ikincisi səhifə daxilindəki ankara işarə edir).
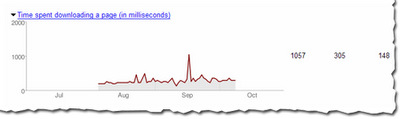
Burada isə hər gün bu bloqdan endirilən orta kilobayt sayı göstərilib. Gördüyünüz kimi, sayt son iki ay yarım ərzində böyüdükcə, endirilən orta kilobaytların sayı da artıb.
Bunu necə tətbiq edirik
Google announcements age. We keep this post here for the record, and we note for clients whether the behaviour it describes still applies today or has since been superseded.
Əlaqəli xidmətlər